Estimation and measurement methods
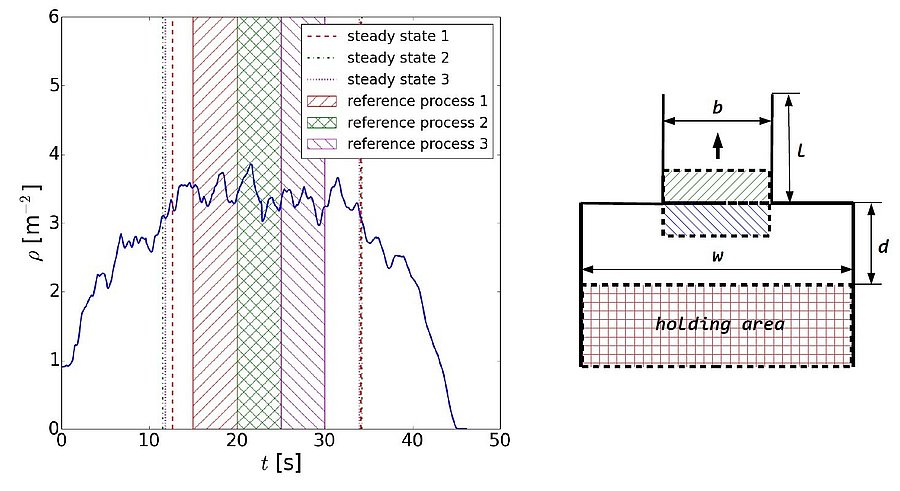
This section concerns statistical methods and models for estimation of traffic and pedestrian flow macroscopic variables such as mean speed, flow, or flow density, or the detection of stationary states in time sequences using CUSUM statistics and regressive processes. The CUSUM statistic is a Markovian process for which the stationary distribution is unique and given by the forward Kolmogorov equation (Fokker-Planck or global balance equation). The solutions can be approximated numerically by solving the linear system (Thomas algorithm) or simulating the regressive process.
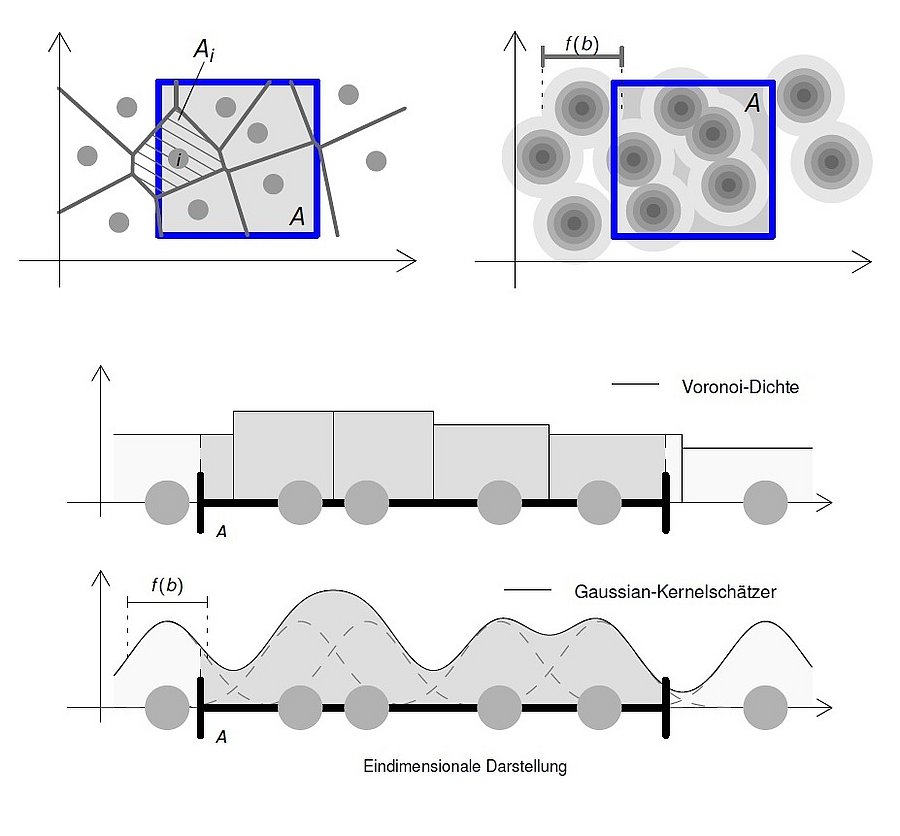
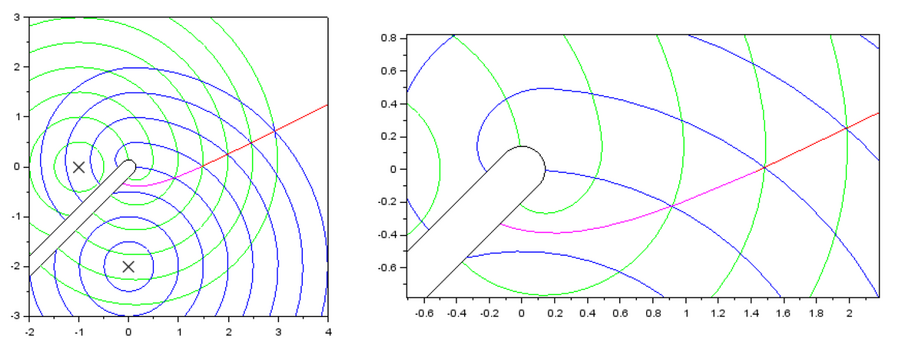
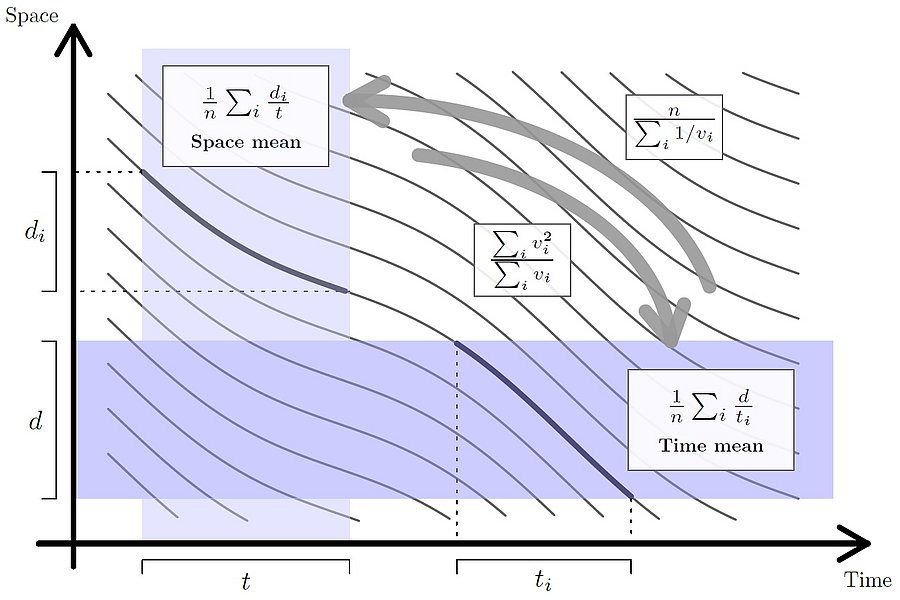
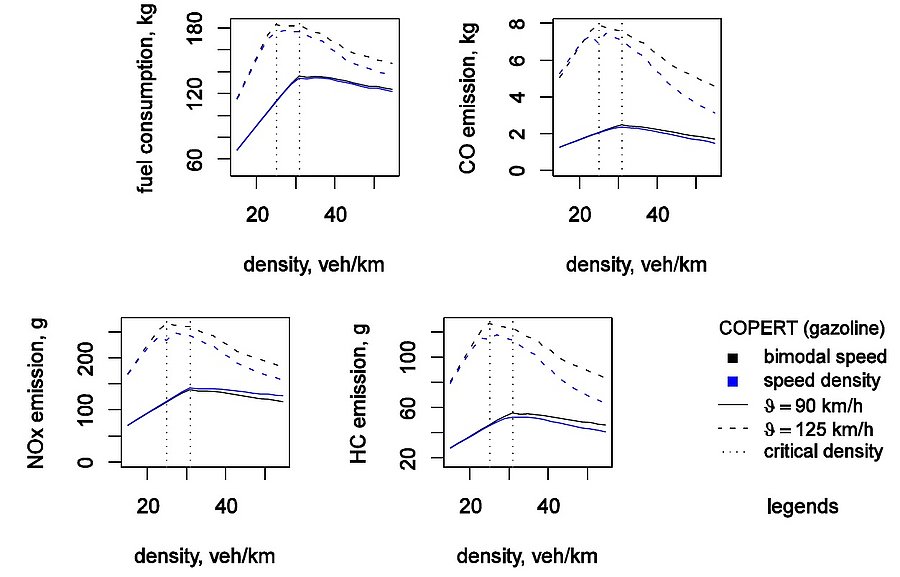
Other focuses go on flow density estimation by Voronoi diagram and kernel methods, notably in presence of obstacles, time and space mean speed by harmonic and quadratic estimates, and road traffic fuel consumption and pollutant emission estimation for different speed distributions.
- M. Chraibi, B. Steffen and A. Tordeux, "Analysis of pedestrian motion using Voronoi diagrams in complex geometries" in Traffic and Granular Flow 2019, Springer, 2020, pp. 39-44.
- M. Boltes, J. Zhang, A. Tordeux, A. Schadschneider and A. Seyfried, "Empirical results of pedestrian and evacuation dynamics", Encyclopedia of Complexity and Systems Science, vol. 16, pp. 1-29, 2018. Springer Berlin, Germany.
Further references
W Liao, A Tordeux, A Seyfried, M Chraibi, K Drzycimski, X Zheng, Y Zhao (2016) Measuring the steady state of pedestrian flow in bottleneck experiments. Physica A 461:248–261. Presentation
A Tordeux, J Zhang, B Steffen and A. Seyfried (2015) Quantitative comparison of estimations for the density within pedestrian streams. JSTAT P06030.
V Aguiléra, A Tordeux (2014) A new kind of fundamental diagram with an application to road traffic emission modeling. J Adv Transport 48(2):165–184. Pres1, Pres2 (in French)
A Tordeux, V Aguiléra (2011) Integration of a speed-dependent emission model in dynamic traffic assignment. Procedia - Social and Behavioral Sciences 20:475–484. Presentation
A poster about the analysis of pedestrian motion and estimation of local density using Voronoi diagrams is available here.

